Leon Frank · 11 September 2026
Evaluating Real-World Expenditures in Additive Manufacturing of Spacecraft Joints Under Simulated Microgravity Conditions
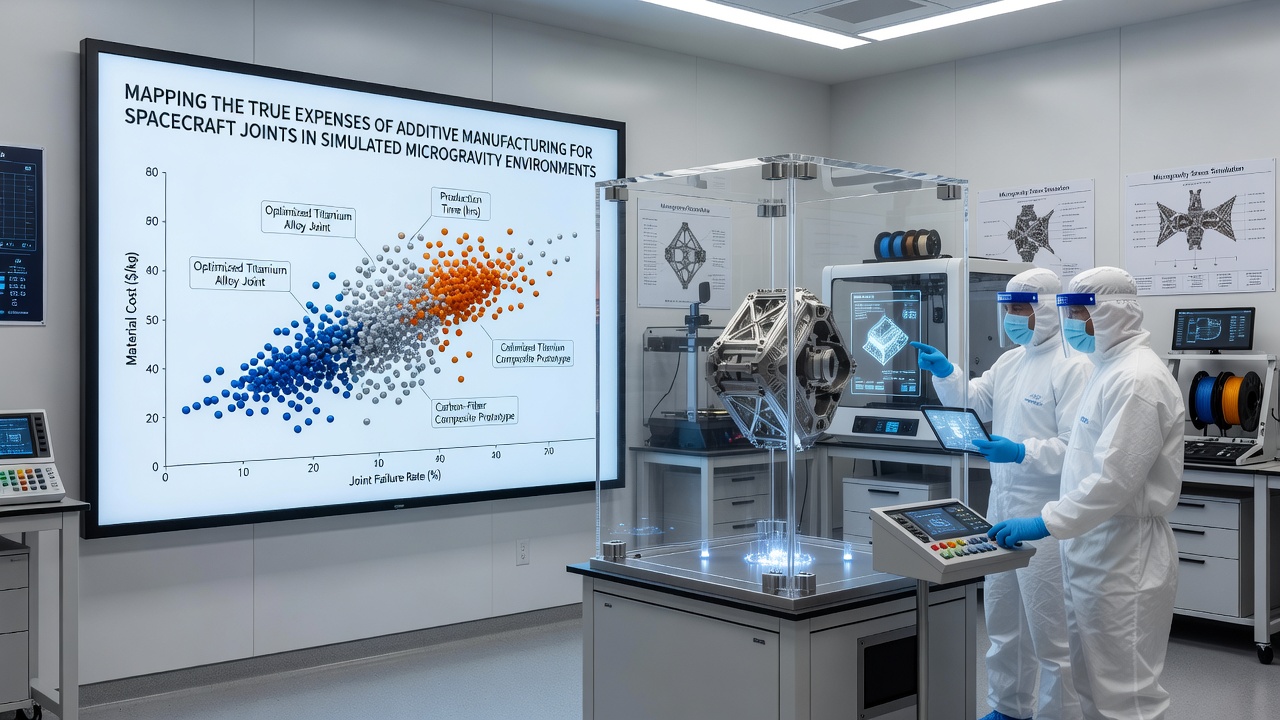
Researchers at multiple institutions continue to examine the full spectrum of costs associated with producing spacecraft joints through additive manufacturing techniques while operating in simulated microgravity settings, and these investigations incorporate equipment depreciation, material consumption rates, energy demands, and specialized testing protocols that extend well beyond initial fabrication steps. Data from ongoing projects indicate that titanium and aluminum alloys remain primary feedstocks, yet the expenses tied to powder handling and recycling systems often account for 30 to 40 percent of total project budgets according to records maintained by the European Space Agency.
Breakdown of Direct Manufacturing Costs
Equipment acquisition and maintenance represent the largest single line item in most additive manufacturing workflows for spacecraft components, with laser powder bed fusion machines requiring annual calibration and component replacement that can exceed several hundred thousand euros per unit. Studies conducted at facilities equipped with parabolic flight simulators show that each test cycle consumes between 15 and 25 kilograms of raw material, and the associated filtration and containment measures add measurable overhead because microgravity conditions alter powder flow dynamics in ways that increase waste percentages compared with terrestrial operations.
Energy consumption during the build phase rises noticeably when printers must compensate for vibrational isolation systems and vacuum chamber controls necessary to mimic orbital environments, and operators report that power draw can climb by 18 percent during extended runs. Labor expenses also shift because technicians require additional training to manage remote monitoring interfaces that account for the absence of gravitational settling in the build chamber.
Testing and Validation in Simulated Microgravity
Facilities such as drop towers and aircraft-based parabolic flights provide the controlled conditions needed to validate joint performance, yet each session carries substantial logistical fees that include aircraft time, safety oversight, and data acquisition hardware. A single parabolic flight campaign lasting five days typically incorporates 40 to 60 microgravity intervals, and the cost per interval ranges from 2,500 to 4,000 euros once insurance, ground support, and post-flight analysis are included. Researchers note that additive-manufactured joints must undergo repeated thermal cycling adn load testing immediately after fabrication to capture any microstructural changes induced by the simulated environment.
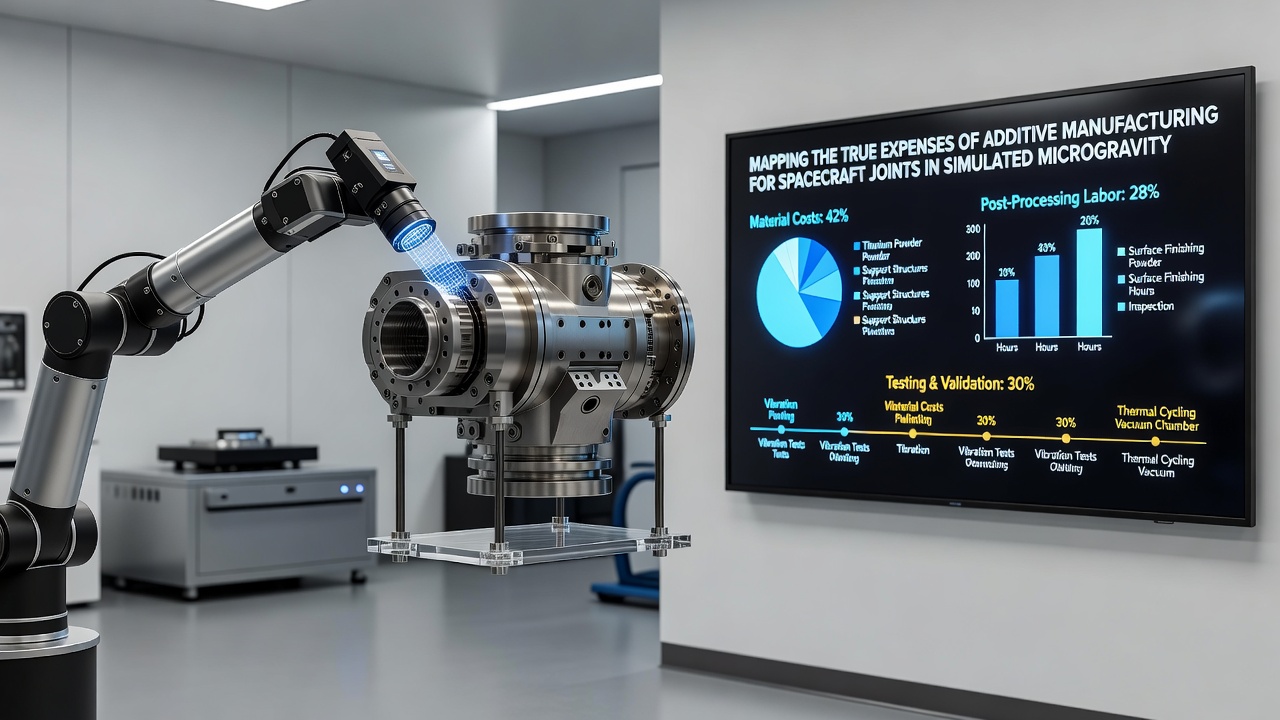
September 2026 marks the scheduled release of updated cost-modeling software developed under a joint program between NASA and several European universities, and early documentation suggests the tool will integrate real-time sensor data from build chambers with flight-test expenditure logs to generate more accurate projections for future missions. The software update follows three years of data collection that tracked over 120 individual joint prototypes across multiple alloy compositions.
Indirect and Hidden Expense Categories
Post-processing steps such as hot isostatic pressing and surface finishing frequently double the overall outlay because microgravity-formed parts exhibit different residual stress patterns that demand specialized heat-treatment schedules. Quality assurance protocols also expand to include non-destructive evaluation methods like computed tomography scans performed under vibration-free conditions, and each scan can require several hours of machine time plus interpretation by certified analysts. Supply chain considerations enter the equation when specialized powders must be transported under inert atmospheres, adding freight and storage fees that scale with distance from production sites.
Insurance premiums for facilities conducting microgravity experiments have risen steadily since 2023, driven by documented incidents involving powder dispersion during simulated weightless intervals. Organizations therefore allocate contingency funds that represent 12 to 15 percent of baseline budgets to cover potential delays or equipment recalibrations following unexpected test outcomes.
Comparative Data Across Institutions
Figures compiled by the Canadian Space Agency reveal that Canadian-led projects incur approximately 22 percent lower testing costs than equivalent U.S. programs because of access to national drop-tower infrastructure, whereas Australian research teams report higher material transport expenses due to geographic isolation from major alloy suppliers. These regional variations underscore the importance of location-specific modeling when agencies plan multi-year spacecraft development roadmaps. A 2025 report from the International Astronautical Federation highlighted that collaborative projects pooling resources across borders achieved measurable reductions in per-unit joint costs through shared equipment amortization.
Observers note that digital twin simulations are increasingly used to reduce the number of physical test flights required, and preliminary results indicate potential savings of up to 35 percent in validation budgets when models are calibrated against at least two full-scale microgravity campaigns. The approach still necessitates physical verification for critical load-bearing joints, however, because current simulation fidelity has not yet eliminated all discrepancies observed in actual flight data.
Conclusion
Comprehensive cost mapping for additive manufacturing of spacecraft joints in simulated microgravity environments continues to evolve as new datasets become available and modeling tools improve. Institutions worldwide track direct outlays alongside indirect factors such as regulatory compliance, insurance adjustments, and regional infrastructure differences to produce more reliable forecasts. The upcoming software release scheduled for September 2026 is expected to further refine these projections by incorporating additional flight-test variables and regional economic indicators.